本記事では Vue.js v3とTypeScriptを使用して、インタラクティブで美しい折れ線グラフを作成する方法を紹介します。vue3-charts ライブラリを活用し、TypeScript を有効にした Vue3 プロジェクト において、簡単に グラフ を追加する方法を ステップバイステップ で説明します。実装にあたり必要となる エラーハンドリング から スタイリング、 インタラクティブ な要素の追加まで、実践的な アプローチ を通じて Vue3 での グラフ作成を実現していこうと思います。
本記事では 折れ線グラフ(Line Chart) に関する コンポーネント 部分についてのみ説明するため、前提となる プロジェクト の概要については、以下の記事を参考にしてください。


折れ線グラフ コンポーネント 作成
折れ線グラフ (Line Chart) を components/LineChart.vue に実装していきます。 ベース となる コード は 公式サイト で提供されていますので、それを活用していきます。

<scirpt>, <template> の順番だけ、Vue3 with TypeScript のお作法に従って修正した コンポーネント は以下の通りです。
<script lang="ts">
import { defineComponent, ref } from 'vue'
import { Chart, Grid, Line } from 'vue3-charts'
import { plByMonth } from '@/data'

export default defineComponent({
    name: 'LineChart',
    components: { Chart, Grid, Line },
    setup() {
        const data = ref(plByMonth)
        const direction = ref('horizontal')
        const margin = ref({
            left: 0,
            top: 20,
            right: 20,
            bottom: 0
        })

        const axis = ref({
            primary: {
                type: 'band',
                format: (val: string) => {
                    if (val === 'Feb') {
                        return '😜'
                    }
                    return val
                }
            },
            secondary: {
                domain: ['dataMin', 'dataMax + 100'],
                type: 'linear',
                ticks: 8
            }
        })

        return { data, direction, margin, axis }
    }
})
</script>
<template>
<Chart :size="{ width: 500, height: 420 }" :data="data" :margin="margin" :direction="direction" :axis="axis">
<template #layers>
<Grid strokeDasharray="2,2" />
<Line :dataKeys="['name', 'pl']" />
<Line :dataKeys="['name', 'avg']" :lineStyle="{ stroke: 'red' }" type="step" />
</template>
<template #widgets>
<Tooltip borderColor="#48CAE4" :config="{
name: { hide: true },
pl: { color: '#0077b6' },
avg: { label: 'averange', color: 'red' },
inc: { hide: true }
}" />
</template>
</Chart>
</template>ただし、この コンポーネント を用いて プロジェクト を実行するといくつかの エラー が出力されてしまいます。
src/components/LineChart.vue:42:78 - error TS2322: Type 'string' is not assignable to type 'Direction | undefined'.

42     <Chart :size="{ width: 500, height: 420 }" :data="data" :margin="margin" :direction="direction" :axis="axis">
                                                                                ~~~~~~~~~~

  node_modules/vue3-charts/dist/components/Chart/index.vue.d.ts:91:5
    91     direction: Direction;
           ~~~~~~~~~
    The expected type comes from property 'direction' which is declared here on type 'Partial<{ data: Data[]; margin: Margin; size: Size; direction: Direction; config: Partial<ChartConfig>; }> & Omit<{ readonly data: Data[]; ... 4 more ...; readonly axis?: ChartAxis | undefined; } & VNodeProps & AllowedComponentProps & ComponentCustomProps & Readonly<...>, "data" | ... 3 more ... | "config"> & Record...'

src/components/LineChart.vue:42:101 - error TS2322: Type '{ primary: { type: string; format: (val: string) => string; }; secondary: { domain: string[]; type: string; ticks: number; }; }' is not assignable to type 'ChartAxis'.

42     <Chart :size="{ width: 500, height: 420 }" :data="data" :margin="margin" :direction="direction" :axis="axis">
                                                                                                       ~~~~~

  node_modules/vue3-charts/dist/components/Chart/index.vue.d.ts:79:5
    79     axis: {
           ~~~~
    The expected type comes from property 'axis' which is declared here on type 'Partial<{ data: Data[]; margin: Margin; size: Size; direction: Direction; config: Partial<ChartConfig>; }> & Omit<{ readonly data: Data[]; ... 4 more ...; readonly axis?: ChartAxis | undefined; } & VNodeProps & AllowedComponentProps & ComponentCustomProps & Readonly<...>, "data" | ... 3 more ... | "config"> & Record...'


Found 4 errors.

ERROR: "type-check" exited with 2.次のセクションでは、LineChart.vue で発生したこれらのエラーにどのように対処していくかを詳しく説明していきます。
LineChart.vue エラー 対処
まず対処していくのは TS2322 という エラー で、「型がきちんと一致していない値を代入しようとしている」 というような内容です。
error TS2322 について
具体的な エラー の内容は例えば、以下のようなものです
consolesrc/components/LineChart.vue:42:78 - error TS2322: Type 'string' is not assignable to type 'Direction | undefined'.
42 <Chart :size="{ width: 500, height: 420 }" :data="data" :margin="margin" :direction="direction" :axis="axis">この エラー を発生させている ソースコード は LineChart.vue の以下の部分です。 Chart コンポーネントの プロパティ :direction への設定部分で問題が発生しています。
LineChart.vue <Chart :size="{ width: 500, height: 420 }" :data="data" :margin="margin" :direction="direction" :axis="axis">:direction プロパティ に設定しようとしている direction 変数の型に問題があるということですので、direction 変数の内容を確認していきます。
LineChart.vueexport default defineComponent({
name: 'LineChart',
components: { Chart, Grid, Line },
setup() {
const data = ref(plByMonth)
const direction = ref('horizontal')これらの状況を整理すると以下のようになります
| Item | 型 | 設定値、定義 |
|---|---|---|
direction 変数 | String | ref(‘horizontal’) |
:direction プロパティ | Direction | export type Direction = 'horizontal' | 'vertical' | 'circular' |
Chart コンポーネントの direction プロパティが Direction 形で定義されているにもかかわらず、LineChart.vue から設定している値は String 型になっているため不一致が発生してしまっています。
vue3-charts/src/types/index.tsexport type Direction = 'horizontal' | 'vertical' | 'circular'error TS2322 への対処
エラー の原因が分かりましたので、この TS2322 に対処していきます。エラーメッセージ の指示通りに string 型の 'horizontal' を以下のように Direction 型の ‘horizontal’ とすればよいです。
LineChart.vue const direction: Ref<Direction> = ref('horizontal')なお、 axis 変数 についても同様の エラー となっていますので、同様に以下のように修正します。
        const axis: Ref<ChartAxis> = ref({
            primary: {
なお、合わせて以下のように Ref, Direction を import してください。
LineChart.vueimport type { Ref } from 'vue'import type { Direction, ChartAxis } from 'vue3-charts/src/types'TS1484 について
既存の import に続けて以下のように記載せずに import type を用いるべき理由は以下を参照してください
import { defineComponent, ref, Ref } from 'vue'
さて、上記対処をして プロジェクト を実行すると、また新たな エラー に直面します。
ChartAxis 型に必要な情報の補完
ここまでの対処で、 エラー は確実に消えてきていますが、 今度は axis 変数について、以下の エラー が出力されます。
Type 'Ref<{ primary: { type: "band"; format: (val: string) => string; }; secondary: { domain: [string, string]; type: "linear"; ticks: number; }; }>' is not assignable to type 'Ref<ChartAxis>'.
  Type '{ primary: { type: "band"; format: (val: string) => string; }; secondary: { domain: [string, string]; type: "linear"; ticks: number; }; }' is not assignable to type 'ChartAxis'.ts(2322)
index.ts(60, 3): 'domain' is declared here.
これも 先ほどまでと基本的には同じ内容ですが、 ChartAxis 型に必要な primary/domain プロパティ が未設定であることが原因です。 ですので、以下のように axis 変数 の primary の domain に値を設定していきます。
LineChart.vue const axis: Ref<ChartAxis> = ref({
primary: {
domain: ['dataMin', 'dataMax'],
type: 'band',
format: (val: string) => {
if (val === 'Feb') {
return '😜'
}
return val
}
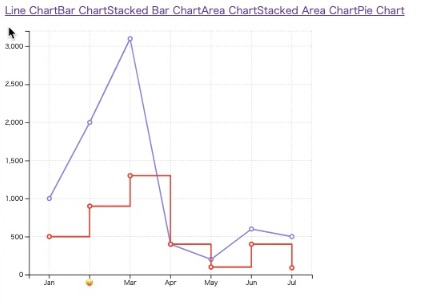
},ここまでで、 プロジェクト の ビルド は成功し、以下のような 折れ線グラフ が表示されていると思います。
ただし、 LineChart.vue コンポーネント にはもう少し改善点がありますので、それらに対処していきます。
eslint への 対処
components 定義の部分で以下のような ワーニング が出力されていると思います。
LineChart.vueName "Line" is reserved.eslintvue/no-reserved-component-namesLine という名前は eslint としては予約済みのため、別の名前を用いるよう提案されていますので、別名を用いることで対処していきます。
Line コンポーネント を インポート している以下の部分を as を用いて別名として インポートします。 合わせて コンポーネント 定義部分も 別名を用います。
LineChart.vueimport { Chart, Grid, Line as LineChartComponent } from 'vue3-charts'export default defineComponent({
name: 'LineChart',
components: { Chart, Grid, LineChartComponent },template 部分も 忘れずに コンポーネント名を変更します
<template #layers>
<Grid strokeDasharray="2,2" />
<LineChartComponent :dataKeys="['name', 'pl']" />
<LineChartComponent :dataKeys="['name', 'avg']" :lineStyle="{ stroke: 'red' }" type="step" />
</template>Tooltip, Marker サブコンポーネント 追加
ここまででも問題なく 折れ線グラフ が表示されていますが、 vue3-charts には さらに Tooltip, Marker という サブコンポーネント がありますので、これらを活用していきます。 実際、現状の プロジェクト 実行時には 以下のように ブラウザ の コンソールログ に ワーニング が出力されています。
BrowserLineChart.vue:41 [Vue warn]: Failed to resolve component: Tooltip
If this is a native custom element, make sure to exclude it from component resolution via compilerOptions.isCustomElement.
at <LineChart onVnodeUnmounted=fn<onVnodeUnmounted> ref=Ref< undefined > >
at <RouterView>
at <App>コンポーネント | 説明 |
|---|---|
Marker | グラフのデータとは別の系列で線を引くことができる |
Tooltip | データポイント上にマウスを合わせると、実際の値を表示することができる |
コンポーネント インポート
以下のように Tooltip, Marker を インポートしていきます。 なお、 Marker コンポーネント は Line コンポーネント同様 予約済みの名前と バッティング してしまうため、 ChartMarker として インポート していきます。
LineChart.vueimport {
Chart,
Grid,
Tooltip,
Marker as ChartMarker,
Line as LineChartComponent,
} from 'vue3-charts'export default defineComponent({
name: 'LineChart',
components: { Chart, Grid, Tooltip, ChartMarker, LineChartComponent },これで Tooltip, Marker を使う準備ができましたので、引き続きこれらの コンポーネント を設置していきます。
Marker サブコンポーネント設置
以下のように LineChartComponent と並列の関係で設置していきます。 今回は 1200 の値に Target というラベルを付与した波線を表示してみます。
LineChart.vue <template #layers>
<Grid strokeDasharray="2,2" />
<LineChartComponent :dataKeys="['name', 'pl']" />
<LineChartComponent :dataKeys="['name', 'avg']" :lineStyle="{ stroke: 'red' }" type="step" />
<ChartMarker :value="1200" label="Target" color="black" :strokeWidth="2" strokeDasharray="6 6" />
</template>| プロパティ | 説明 |
|---|---|
value | 線を引く値を指定 |
label | 線に付与するラベル名称 |
color | 線の色を指定 |
strokeWidth | 線の幅を指定 |
strokeDasharray | 線の波線の書式を指定。 最初の値: 線の長さ 二つ目の値: ギャップの長さ |
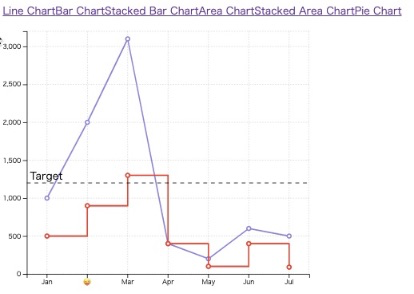
実際に表示した状態は以下のようになります。
Tooltip コンポーネント の設置
続いて、 Tooltip コンポーネント を設置していきます。 といっても、こちらに関しては 公式のサンプルコード にすでに含まれているので、そのまま使っていきます。
LineChart.vue <template #widgets>
<Tooltip borderColor="#48CAE4" :config="{
name: { hide: true },
pl: { color: '#0077b6' },
avg: { label: 'averange', color: 'red' },
inc: { hide: true }
}" />
</template>Tooltip の場合、 データソース について、それぞれを設定していくことになります。
| プロパティ | 説明 |
|---|---|
hide | ツールチップに表示するしないを指定 指定しない場合は false となり 表示する |
color | ツールチップ内の文字色を指定 |
label | ツールチップ内のラベル文字列を指定。 指定しない場合はデータソースのものをそのまま表示 |
上記設定で設置した場合、以下のように表示されます。

バリエーションを試してみる
さらに、データソース の全ての系列を 折れ線グラフ として表示したり、他の グラフ との比較もしやすいように データソース の各系列ごとに色分けをしたり、折れ線グラフのスタイルのバリエーションを少し試してみます。
| Data Legend | LineStyle | color | type |
|---|---|---|---|
pl | stroke | red | normal(default) |
avg | stroke | green | step |
inc | stroke | blue | monotone |
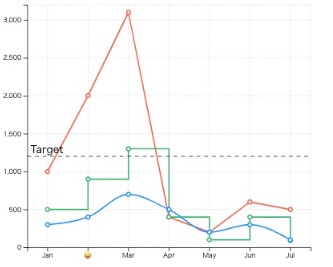
バリエーション を試してみた グラフ は以下のようになりました。 なお step には 他にも natural が利用可能です。
最終的な LineChart.vue の コード は以下のようになっています。
LineChart.vue<script lang="ts">
import { defineComponent, ref } from 'vue'
import type { Ref } from 'vue'
import {
Chart,
Grid,
Tooltip,
Marker as ChartMarker,
Line as LineChartComponent,
} from 'vue3-charts'
import type { Direction, ChartAxis } from 'vue3-charts/src/types'
import { plByMonth } from '@/data'
export default defineComponent({
name: 'LineChart',
components: { Chart, Grid, Tooltip, ChartMarker, LineChartComponent },
setup() {
const data = ref(plByMonth)
const direction: Ref<Direction> = ref('horizontal')
const margin = ref({
left: 0,
top: 20,
right: 20,
bottom: 0
})
        const axis: Ref<ChartAxis> = ref({
            primary: {
                domain: ['dataMin', 'dataMax'],
                type: 'band',
                format: (val: string) => {
                    if (val === 'Feb') {
                        return '😜'
                    }
                    return val
                }
            },
secondary: {
domain: ['dataMin', 'dataMax + 100'],
type: 'linear',
ticks: 8
}
})
return { data, direction, margin, axis }
}
})
</script><template>
<Chart :size="{ width: 500, height: 420 }" :data="data" :margin="margin" :direction="direction" :axis="axis">
<template #layers>
<!-- Generates a dashed line with 2-pixel dashes and 2-pixel gaps as a Grid -->
<Grid strokeDasharray="2,2" />
<LineChartComponent :dataKeys="['name', 'pl']" :lineStyle="{ stroke: '#FF6347' }" />
<LineChartComponent :dataKeys="['name', 'avg']" :lineStyle="{ stroke: '#3CB371' }" type="step" />
<LineChartComponent :dataKeys="['name', 'inc']" :lineStyle="{ stroke: '#1E90FF' }" type="monotone" />
<ChartMarker :value="1200" label="Target" color="black" :strokeWidth="2" strokeDasharray="6 6" />
</template>
<template #widgets>
<Tooltip borderColor="#48CAE4" :config="{
name: { hide: true },
pl: { color: '#FF6347' },
avg: { label: 'averange', color: '#3CB371' },
inc: { color: '#1E90FF' }
}" />
</template>
</Chart>
</template>まとめ
TypeScript に対応するために、 TS2322 への対処が必要
Tooltip, Marker コンポーネント を活用することで より インタラクティブ な グラフ に
Line Chart の スタイル には normal, step, natural, monotone があり、 シンプルな直線や なめらかな曲線など 様々な バリエーション を用いることが可能